The Sales Scoreboard: a spreadsheet that finds your leak
Log one row a day: attempts, connections, appointments, proposals, sales. The Board tab does the rest: this week against your targets, your rates against your industry's floors, and the one stage costing you deals, with the fix next to it. Built by a working commercial sales rep who kept his own score in this exact sheet before building Pipeway.
Free. No spam — the scoreboard, weekly tips on reading your numbers, and first word when Pipeway launches. Unsubscribe anytime.
v2.1 · updated October 2026 · seven tabs, you type on three of them · works in Excel and Google Sheets
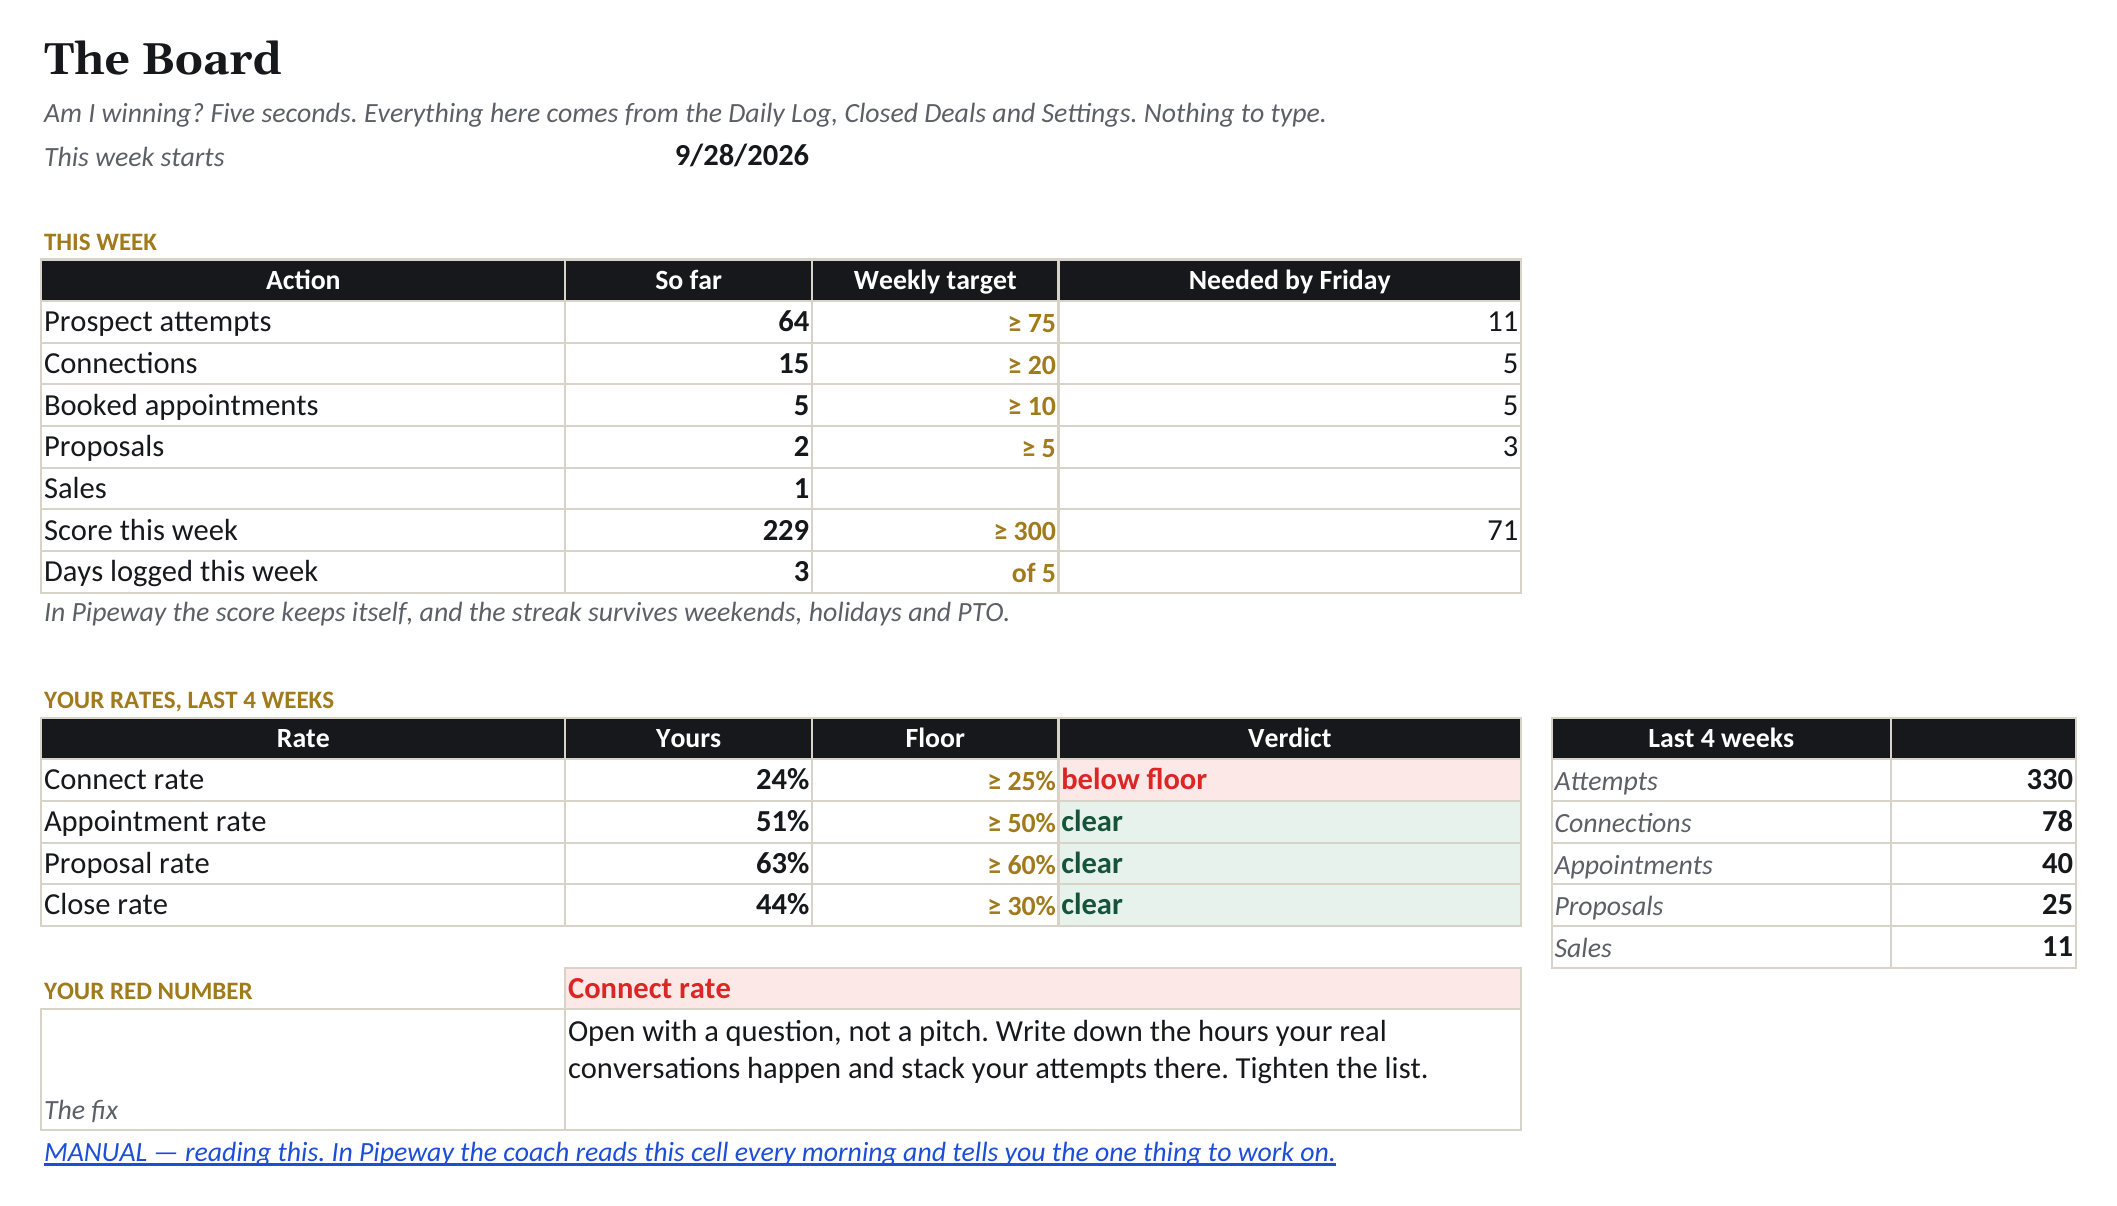
The Board: am I winning, in five seconds.
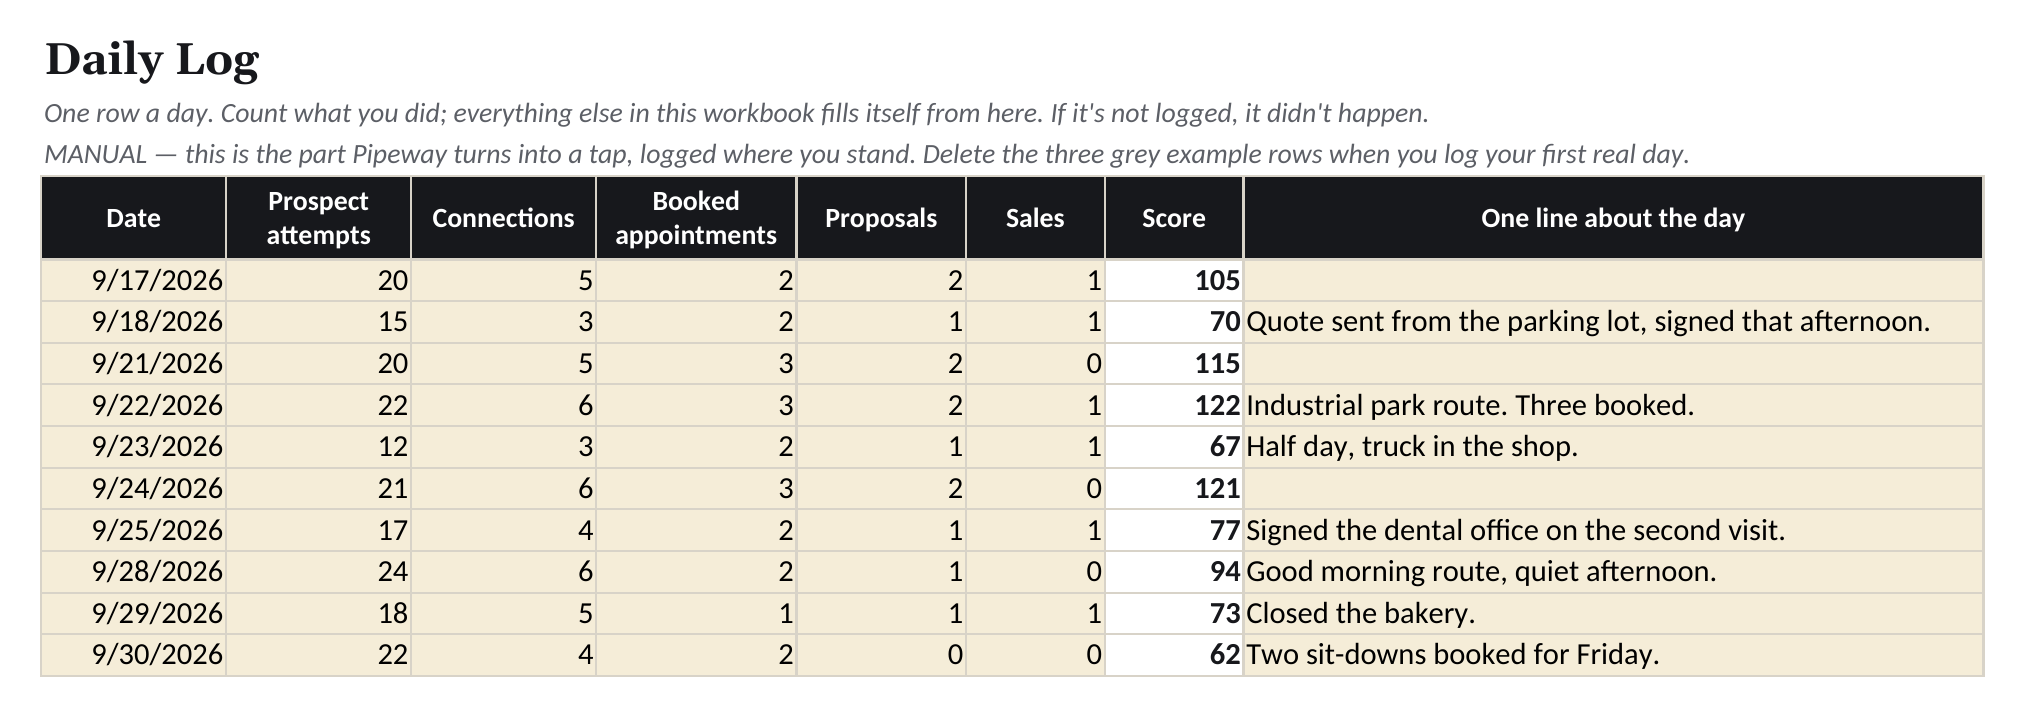
The Daily Log: one row a day, counts only.
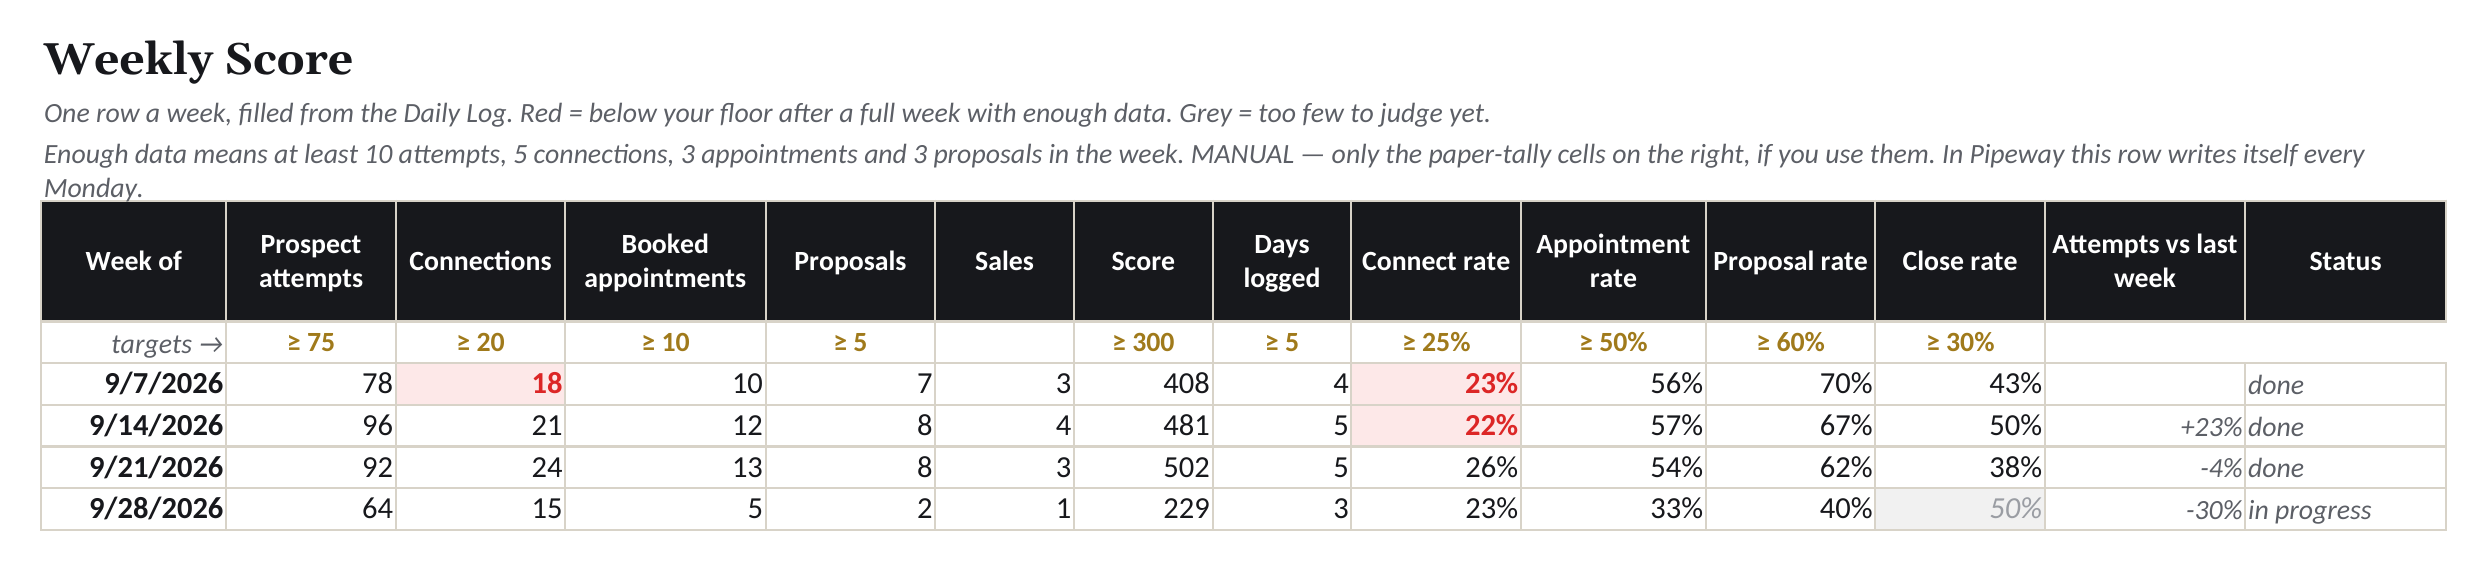
The Weekly Score: filled from the log, red below your floor.
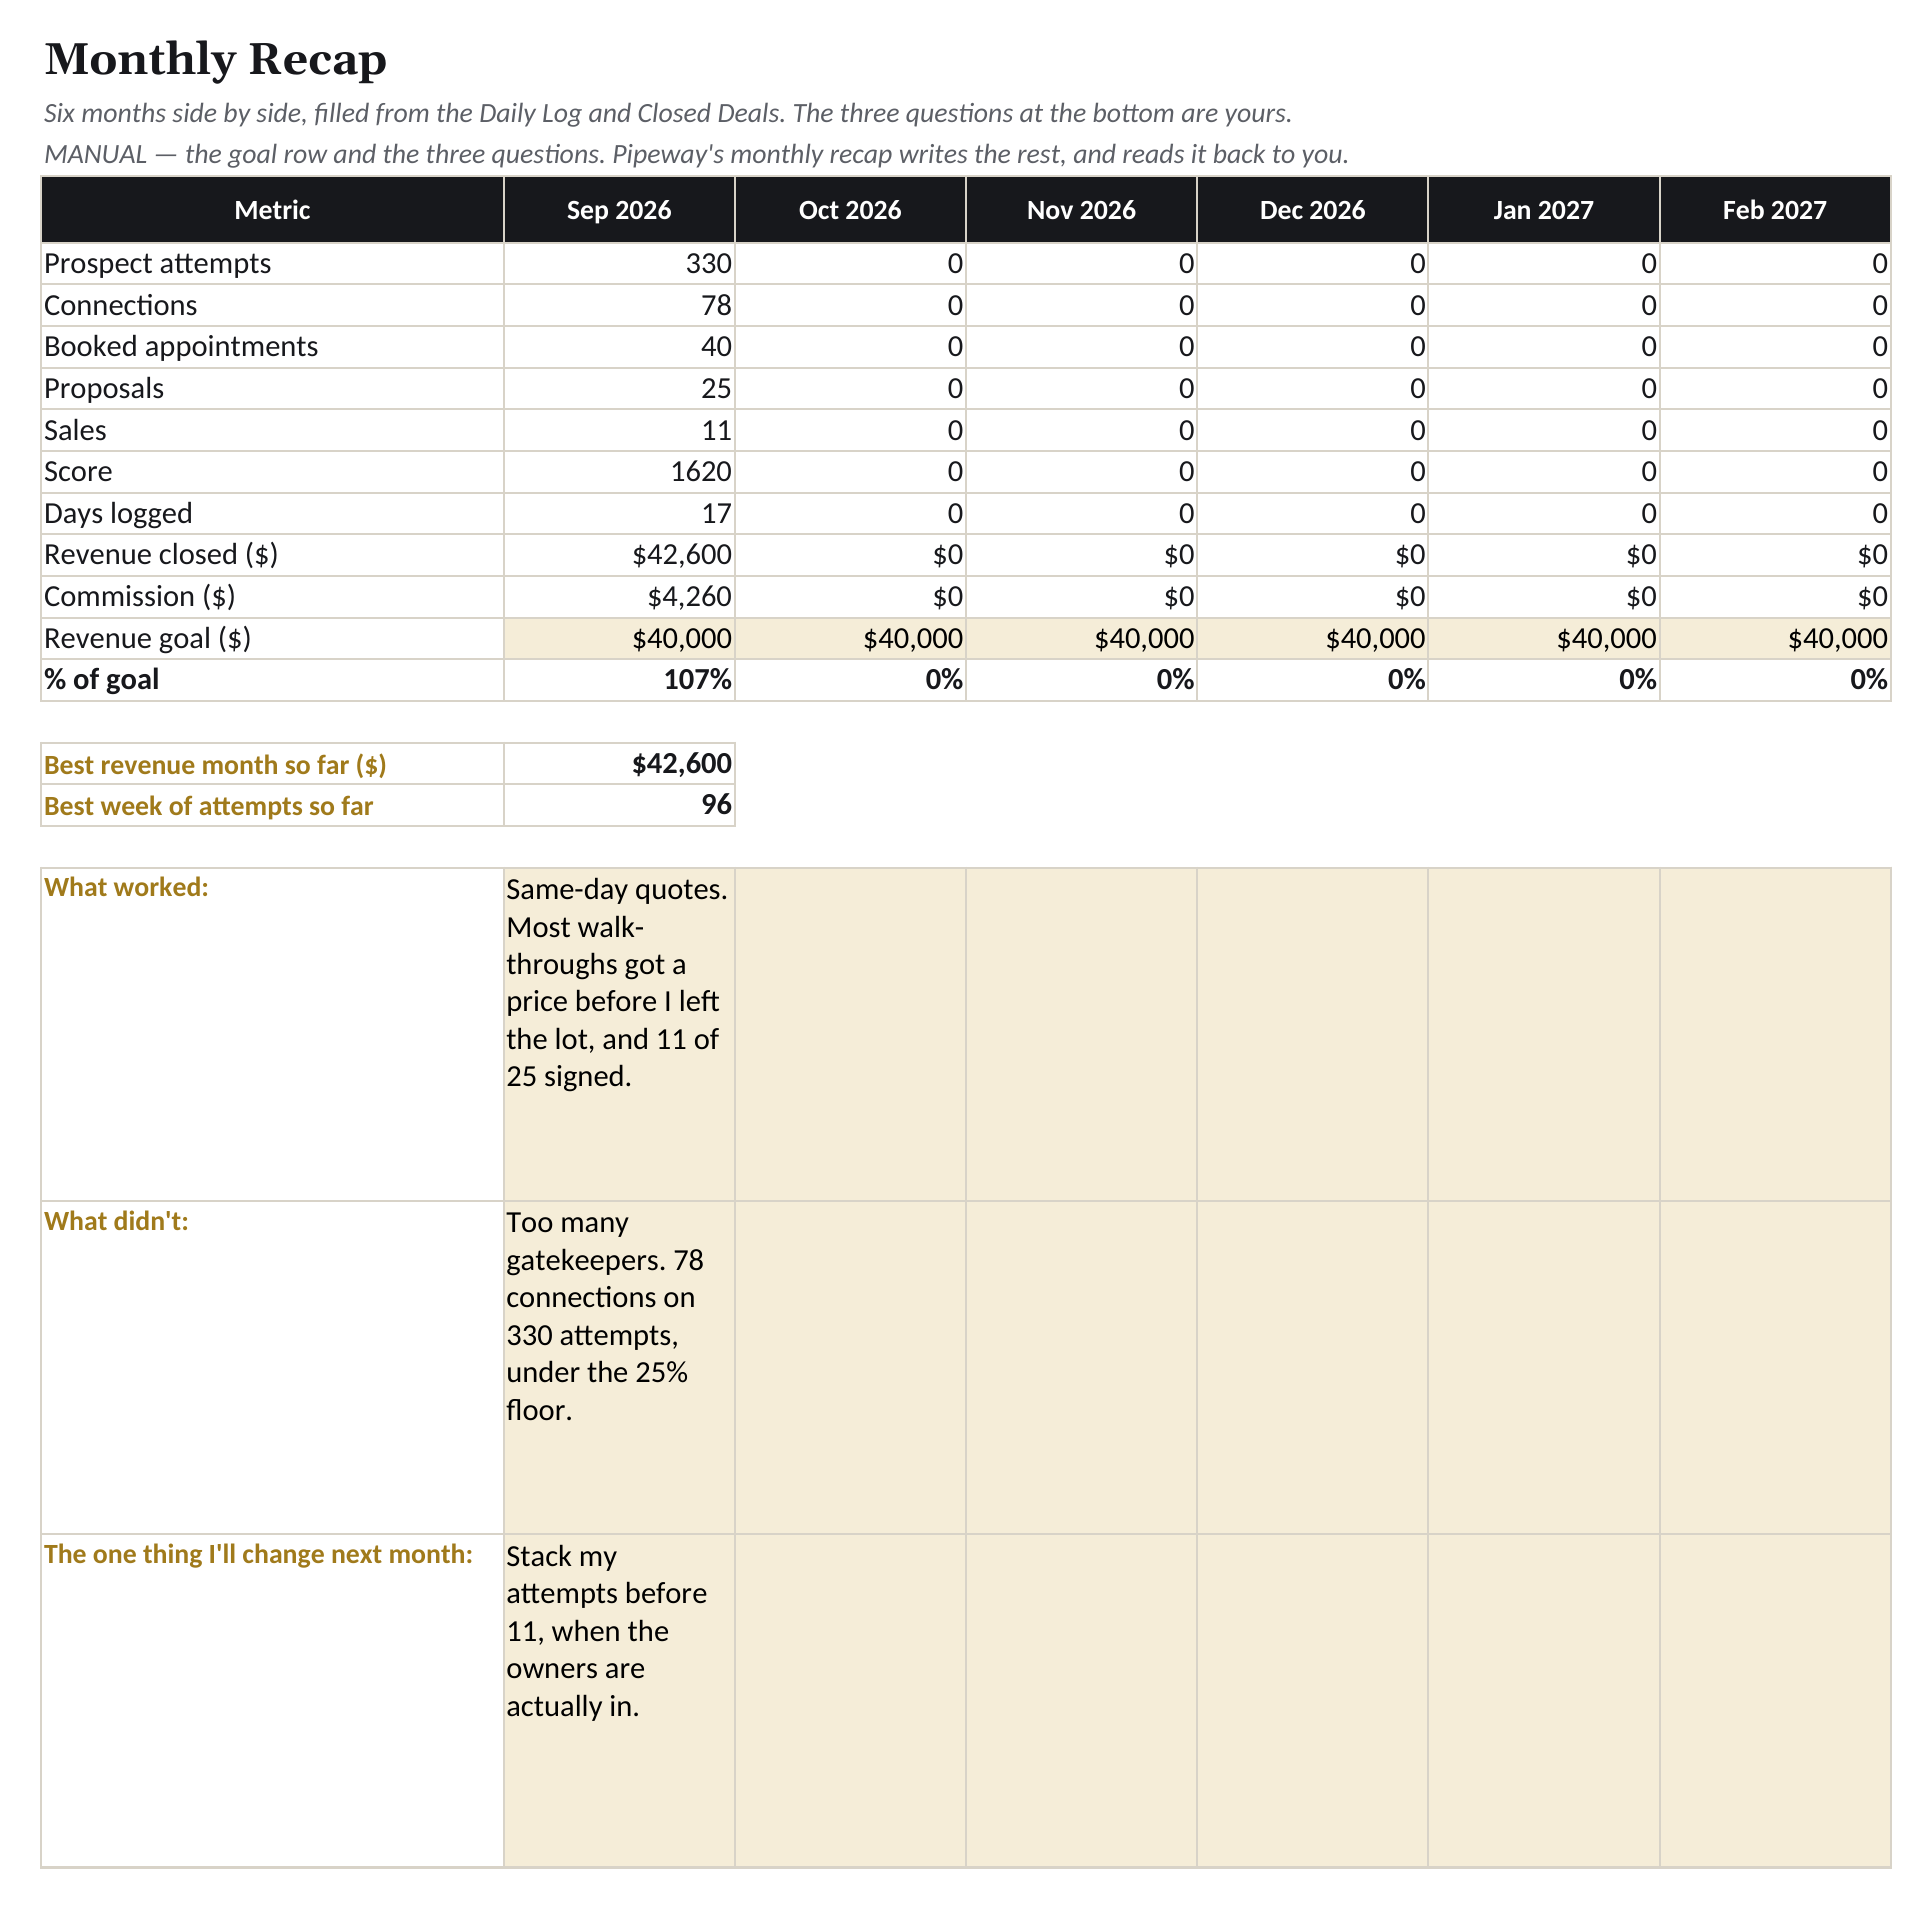
The Monthly Recap: six months, your goal row, the three questions.
Tap any image to see it full size.
Grey means too few to judge yet: an honest board doesn't call a leak on two proposals. Below the month line, the sheet turns your goal into proposals, appointments, connections and attempts per working day, using your own rates once the sample is big enough and your industry's floors until then.
Seven tabs. You type on three of them.
The Board
Am I winning, in five seconds: this week against target, your rates against your floors, your red number and its fix, and what has to happen to hit your month.
Daily Log
One row a day, counts only. Every other tab reads it.
Weekly Score
One row a week, filled from the log. Red below your floor, grey when the sample is too thin, week over week on attempts.
Monthly Recap
Six months side by side, your goal row, your best month, and the three questions.
Closed Deals
Every deal with its commission. The tab Pipeway imports, so your deals come with you.
Settings
Your industry, your revenue goal and deal size, and the floors and weekly targets the research gives your industry — all yours to override.
Start Here
The rule, three steps, and an honest list of what a spreadsheet can't do.
Four habits. Ten minutes a week.
Log one row a day
A date and five counts: attempts, connections, appointments, proposals, sales. Two minutes, logged tonight, not Monday. The rule: if it's not logged, it didn't happen.
Read The Board tab on Friday
This week against your targets, your rates against your industry's floors, and the one red number with its fix. The log fills it. Nothing to type.
Trust the red, and the grey
A rate below your floor turns red after a full week with enough data. Too few to judge yet turns grey, because an honest board doesn't call a leak on thin numbers.
Fix one thing at a time
At month end the recap is already written. Answer three questions and pick ONE change for next month. That's the whole system — it took me from hitting 2 of my first 10 months to 7 of the next 8.
Doors, dials, demos. Your industry's floors, not an average.
A 12% connect rate is a crisis in pest control and a solid week in SaaS. The Settings tab carries floors and weekly targets for 31 industries from the research behind Pipeway's presets, and a general setting for everyone else. Pick yours and every red cell is judged against your world. See every industry's benchmarks →
Commercial Services / Route-Based B2B
Connect 27–35% · Appointments 50–54%
Software / SaaS / Cloud Tech
Connect 9–17% · Appointments 10–13%
Insurance (commercial / small-business lines)
Connect 13–17% · Appointments 30–38%
B2B Professional Services & Staffing (inside)
Connect 15–20% · Appointments 17–21%
Wholesale Trade / Industrial Distribution
Connect 12–16% · Appointments 31–39%
Medical Device Sales
Volume-driven motion · Appointments 8–10%
Real Estate (Residential)
Connect 10–13% · Appointments 15–19%
Home Improvement / Solar / Roofing (D2D)
Connect 25–33% · Appointments 60–75%
Personal-Lines Insurance (final expense / Medicare, face-to-face)
Connect 22–30% · Appointments 63–78%
What a spreadsheet can't do.
- It needs a laptop, or a cramped grid on your phone.
- It can't log a knock in half a second, or by voice, standing at the door.
- It only shows what you typed, when you got around to typing it.
- It doesn't read your week back to you every morning, and it won't tell you tomorrow's number.
Pipeway does those parts: the four actions logged in half a second, the score and the streak kept for you, and a coach who reads your numbers every morning. The sheet is the same system on paper. It found my leaks. It will find yours. About Pipeway, the app →
Fair questions
Is the scoreboard really free?
Yes. You give an email address, you get the file and a short series of emails on reading your numbers, and you can unsubscribe from any of them. No card, no trial, nothing to install.
Excel, Google Sheets, or my phone?
Both, and your phone through Google Sheets. The file downloads for Excel; the one-tap Google Sheets copy lives in your Drive and opens in the Sheets app. Every formula, dropdown and red cell works in both. Numbers on iPhone opens it but drops the dropdowns, so on a phone use the Sheets copy.
Does it work for inside sales and SDRs, or only for doors?
The stages flex from doors to dials to demos: attempts, connections, appointments, proposals, sales. Pick your industry on the Settings tab and the floors and weekly targets tune themselves. If your motion skips a stage, that stage disappears instead of being judged.
How is this different from a CRM?
A CRM keeps your prospects for your manager. The scoreboard keeps your score for you: counts per day, rates against your industry's floors, and the one stage costing you money. Nothing in it is a customer record, so it never competes with the CRM you already have.
Get the scoreboard. Log one row tonight.
Two minutes a day. Ten minutes on Friday. In two weeks you'll know exactly which stage is costing you deals.
Free. No spam — the scoreboard, weekly tips on reading your numbers, and first word when Pipeway launches. Unsubscribe anytime.